Sales Analytics
Note
If you're a Sertifi Admin+ and use Sertifi eSignatures, ePayments, or eAuthorizations, you can access this report.
The Sales or ESign Analytics report provides a graphical breakdown of the completed folders, documents, and signatures completed on a weekly or monthly basis. This report also provides averages on time to close your eContracts.
Click Sales Analytics from the Reports screen to view this report. The report opens to an overview tab providing updates on:
Yesterday
This Week
Last Week
Month-at-a-glance
You can also choose to view a 12-Month, Calendar, or Admin view.
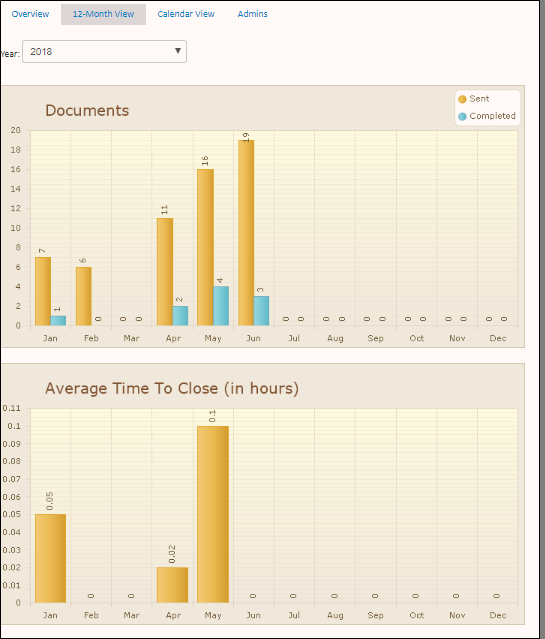
12-Month View
This view contains two graphs that cover the current calendar year. The Documents graph shows the number of sent and completed documents each month. The Average Time To Close (in hours) shows the number of hours to close each month.
The bottom of the view contains a monthly breakdown with more information about how many documents were completed.
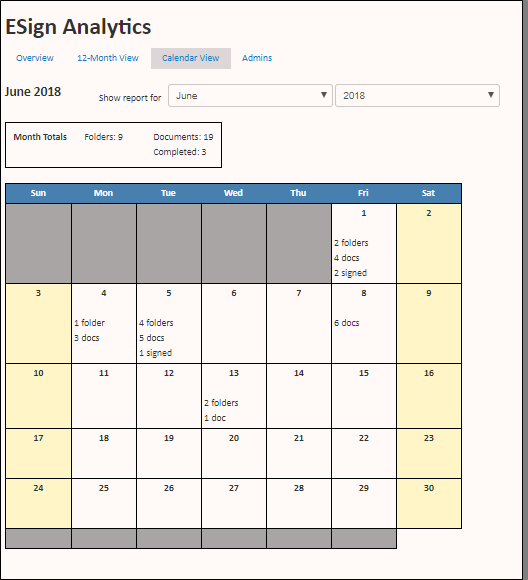
Calendar View
The Calendar View shows a monthly breakdown of completed folders and documents for each day of the selected month and year. You can toggle the month and year you want to see at the top of this view.
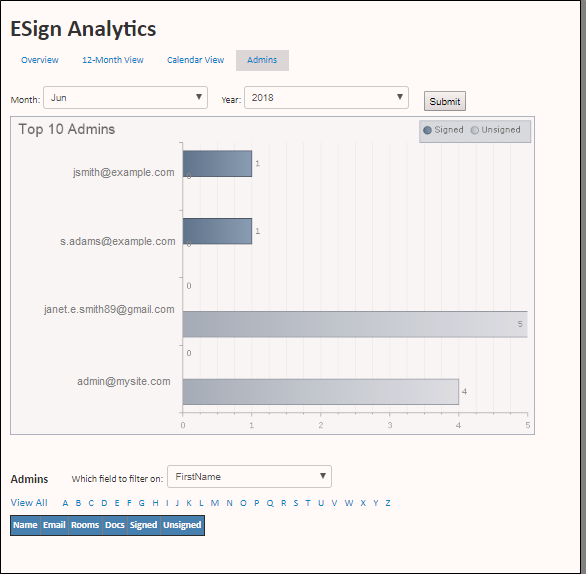
Admins
The Admins View shows the top 10 Admins for the selected month and year. The top 10 Admins that appear in this view are ones who closed the most contracts. You can toggle the month and year you want to see at the top of this view.
You can also filter on first name, last name, or email of the Admin you want to see.